Real activity vs reported activity
Grid draw falls before filings do. Industrial electricity draw, company place and sector, and Eurostat production show distress before the accounts arrive.
Open & official data · kept like an archive
Companies and markets. Energy and climate. Health, research, security, mobility, culture. DataVault gathers the open and official data that exists across the world, keeps every version of it, and makes it ready to query — so the answer you need is already on the shelf.
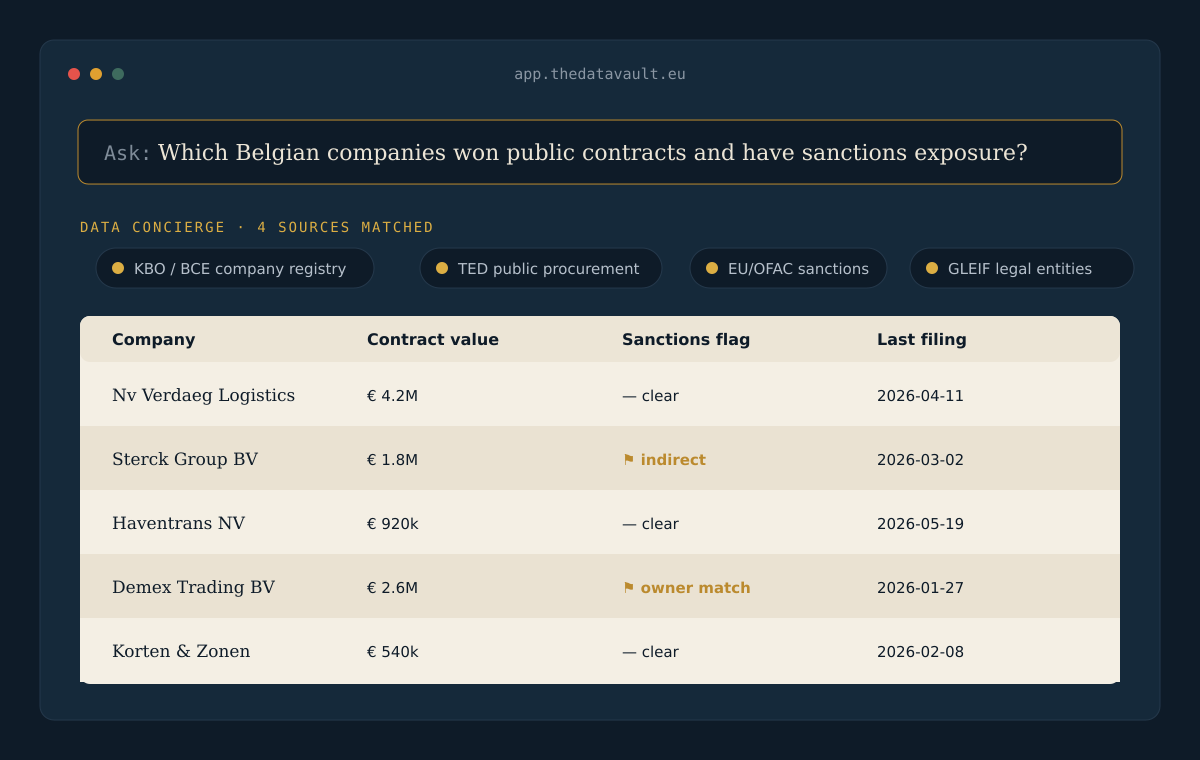
Data concierge
Describe what you're trying to do — in plain language — and the concierge finds the datasets in the vault that can help, and explains how they fit together.
Built for every industry
The same vault serves a bank, a hospital network, a grid operator, a newsroom, and a research lab — because the open data each one needs is collected and kept in one place.
Central-bank series, exchange rates, market and Treasury data, company filings and sanctions for counterparty and credit work.
Business registries, ownership, legal-entity identifiers and procurement awards across dozens of countries.
Known-exploited vulnerabilities, threat feeds, attack techniques, certificate and routing data for defenders and MSSPs.
Grid load and generation, gas flows, renewable assets, EV-charging and wholesale prices across markets.
Drug terminologies and labels, clinical trials, adverse-event reports, provider registries and disease surveillance.
Disaster alerts, storm and flood data, emissions and climate signals, plus company and sanctions exposure.
Legislation, spending and tenders, official statistics and nonprofit records — cross-administration, finally joinable.
Transactions, cadastral and geographic data, building and energy signals to read a market before it turns.
Open product, food and ingredient databases, recalls and safety notices, and demand-side indicators.
Scholarly works, funders and institutions, protein, gene and chemical knowledgebases, and open scientific data.
Museum and library collections, encyclopaedic knowledge, broadcast and the open record of public events.
Aviation and maritime data, transit feeds, vehicle and recall records, trade flows and supply-chain signals.
Data on all kinds of topics
The vault isn't one domain — it's the open record across many. A sample of what's on the shelves:
Cross-domain intelligence
These are not single-feed dashboards. They are join patterns from the vault: public records, energy grids, procurement notices, company registries, sanctions, official statistics and earth-observation catalogs meeting in one place.
Grid draw falls before filings do. Industrial electricity draw, company place and sector, and Eurostat production show distress before the accounts arrive.
Contract awarded, ground not broken. Public money can be compared with construction evidence to spot delay, mismanagement or oversight risk.
A company younger than the tender wins. Incorporation date, awards and ownership graphs expose front-company and collusion patterns that only exist in the join.
An orbital plume tied to an operator. Atmospheric signals and industrial-site registries can turn anonymous emissions into accountable facilities.
Energy price shock, mapped to sector exposure. Power prices and energy-intensive company clusters show where margin pain appears before closures or earnings.
Vegetation stress joins finance exposure. Crop stress, agri-company location and subsidy reliance become an early warning layer for lenders and insurers.
Public money traced through ownership. Tender winners can be walked through LEI and sanctions graphs to find multi-hop exposure to risky entities.
Notebook workbench
Inside the platform, analysts can move from a live source or raw vault artifact into a notebook: query the database, run bounded Python, produce charts, and ask AI to help shape the next step without losing provenance.
select source_id, topic, taken_at, records
from vault.latest_intake
where topic in ('procurement','cyber','energy')
order by taken_at desc
limit 50;
# group fresh intake by topic and collector
df.groupby(['topic','collector']).records.sum()
  .sort_values().tail(12).plot(kind='barh')
AI analyst: “The highest fresh intake is concentrated in environment and cyber. I can build a trend chart by collector, or pivot this into a source-health table with dead-letter risk.”
Graph & complex network analysis
Ownership, procurement, sanctions, source coverage, geography, topics, evidence and signals all become more useful when you can see the relationships. The Investigations workbench lets a user describe a use case, lets AI choose a graph model, then renders a bounded network with metrics and provenance.
Loading the latest collected snapshots and topics to draw a source-topic-country network.
Private Data Exchange
DataVault can also become a marketplace layer for companies, research groups, public bodies and industry organisations that want to sell or license their own datasets to analysts already searching for answers.
Private listings are reviewed case by case. We focus on lawful, well-described datasets with clear ownership, usage rights and real analytical value.
Aggregated machine-utilisation or logistics signals for sector exposure, credit risk and supply-chain analysis.
Anonymised operational benchmarks, waiting-time indicators or facility-level market intelligence for healthcare planning.
Curated field, sensor or inspection datasets that become more useful when joined to assets, companies and geography.
Why most AI work stalls
Across every major study of the last two years, the same story repeats: enterprises pour money into AI, and most of it returns nothing — not because the algorithms fail, but because the data underneath was never ready.
Billions spent, no impact on the bottom line — what researchers call "pilot purgatory."
Root causes cited: poor data infrastructure, fragmentation, unclear ownership.
Up sharply from 17% the year before; the average org abandons ~46% of proofs-of-concept before production.
Where the time actually goes
Before a single model is trained, teams burn most of their effort just locating sources, reconciling formats, governing access and scrubbing errors. It's the most expensive misallocation in modern analytics.
Roughly 45% of a data professional's time goes to finding, loading and cleaning data — more than model training, selection and deployment combined.
And it's a precondition to even starting: 62% of teams name weak data governance their top barrier, while siloed, fragmented data is the obstacle cited most often.
The projects that never begin
The hardest failures are the invisible ones: ideas shelved before a line of code, because the organisation simply doesn't hold the data the question needs.
Meaning 93% know they're building — or hesitating to build — on a foundation that isn't there.
Gartner's projection through 2026; 63% of organisations lack — or aren't sure they have — the data practices AI needs.
Ahead of skills and tooling. The blocker isn't the algorithm — it's not having the data to feed it.
Where DataVault comes in
DataVault removes the part that kills AI projects. The data the world publishes is already collected, kept and ready to query — so you skip the discovery, the wrangling, the governance scramble, and go straight to the question. The ones who can't even start today can start tomorrow.
The open and official sources are gathered once, for everyone. No per-project pipelines to build, no data-janitor hours, no foundation to rebuild from scratch.
The data is already loaded, cleaned into a common shape, governed and kept current. What used to take months of prep is a query away today.
Every version is kept, and sources meet that never lived together — so you can answer questions that were impossible when your data sat in silos.
What people do with it
A few of the ways teams put the data to work — each combining sources that used to live in a dozen places.
Catch counterparty drift before the annual review: register changes, insolvency notices, sanctions hits and late filings, surfaced per portfolio.
Layer historical storms, floods and emissions against exposure to read how a region's risk is shifting over time, not just today.
Spot firms winning contracts, hiring and expanding capacity — months before they show up in a paid database.
Pull publications, trials, gene and chemical references and official statistics into one place, already kept current and historical.
Cross known-exploited vulnerabilities and exploit-prediction scores with threat feeds and routing data to focus the team where it matters.
Bring companies, subsidies, procurement and infrastructure into one view — built from records you already publish, finally connected.
How it works
Hundreds of open and official feeds, in whatever shape they ship, on a schedule that fits each one.
Nothing is overwritten. Each change is kept, so yesterday's record is still there tomorrow.
Browse by topic, open the raw records, and join datasets that never lived together before.
Notebooks and an AI analyst turn questions into queries, tables and charts — in plain language.
Intelligence, built in
For anyone arriving with a question. Describe the problem and get pointed to the exact datasets that help, and how they fit together.
Inside the platform, a data-analyst and dashboard specialist that takes a research question, writes the query, runs it safely, and returns the results.
Why keep it this way
Most sources show only today. Because every version is kept, you can see how things changed — data nobody can reconstruct after the fact.
The value isn't a single feed — it's company records meeting procurement meeting sanctions meeting statistics, resolved and ready.
Hosted in Europe on European infrastructure, drawing only on open and official sources — built for regulated work.
Sources are checked and refreshed on their own cadence, and a self-healing collector keeps the whole living system honest.
Start here
Ask the concierge what the vault holds for your problem, or sign in and explore the full collection, build a notebook, and put the AI analyst to work.
See it work
No pipelines, no waiting. The concierge points to the right sources and the analyst returns the answer from the vault.
Questions & answers
Sources. MIT Project NANDA, The GenAI Divide: State of AI in Business 2025 · RAND Corporation, The Root Causes of Failure for AI Projects (2024) · S&P Global Market Intelligence, AI initiative survey (2025) · Anaconda, State of Data Science (time-allocation benchmark) · Cloudera & Harvard Business Review Analytic Services, Taming the Complexity of AI Data Readiness (2026) · Gartner press release, Lack of AI-Ready Data Puts AI Projects at Risk (2024–2025) · Informatica, CDO Insights (2025). Figures are drawn from published third-party research and reflect industry-wide findings, not DataVault results.